Spectral analysis ensures product quality
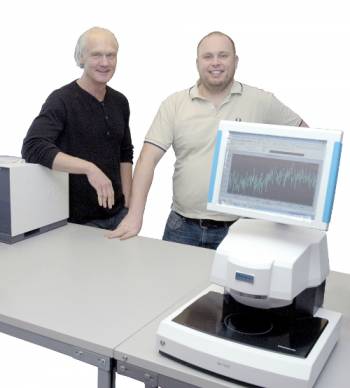
Formaldehyde is a carcinogenic compound in the glue that’s used to manufacture wooden chip boards. The risks were identified and as a consequence a threshold limit value was specified by authorities. Deliveries of chip boards were delayed several days when waiting for the test results. Costs involved in keeping chip boards in stock skyrocketed.A patented Perten instrument solved the problem. It performs testing of chip boards directly in production and produces data on formaldehyde content. That way it’s able to immediately adjust the process for maximum product quality without exceeding threshold limit values. The greatest benefit is of course avoiding unnecessary stock-keeping while undertaking laboratory analysis of the batch. The instrument measuring formaldehyde emission uses Near Infrared, NIR analysis. The method involves illuminating the sample using light with a known spectral composition. A spectrometer is used to analyze the reflected light. The spectral composition of the reflection contains information that’s used to determine the content of a particular substance in the sample.
Advanced mathematical calculations are needed to compare and match the graph to a sample database of characteristic graphs for which the contents of the substance are known.
– Our reference database contains spectra collected from a large number of samples collected in field installations and from measurements made in our in-house laboratory, says Patrik Hedeklint, Development Manager at Perten. |
|
|
|
|
Calibrating instruments using a sample database |
|
|
The database has grown dramatically over the years. Data from a wide variety of ingredients and finished products such as grain, flour, sugar and ethanol is included. The information in the database allows instruments to be calibrated for moisture, protein, starch or fat testing, for example. Accuracy is typically within a tenth of a percent.
|
|
|
The method to compare the spectral composition of the reflected light has been researched since the 1980s to now. With it you compare mathematically with sample spectra and thereby determine the content. Patrik Hedeklint is drawing on the white board to explain. The graph represents the typical spectral composition with characteristic peaks and dips in energy levels over a range of light wave lengths.
Characteristic properties of the graph are represented mathematically and used to determine the content level of the composition of interest. |
|
|
|
|
Grain sample analysis determines the price |
|
|
Perten instruments come in two main shapes depending on use (see image below). Grain collectors and traders use instruments in the lab. A sample from the farmer’s truck load of grain is tested for relevant substances like for instance moisture and protein. The price paid to the farmer is based on the test result. The typical flour mill customer uses Perten technology as part of the process. Instruments continuously test, for instance for protein content in the flour from the mill. The percentage of protein is then used to divide the flour in different fractions. Separation is useful since protein content in many cases decides the best use for the flour. |
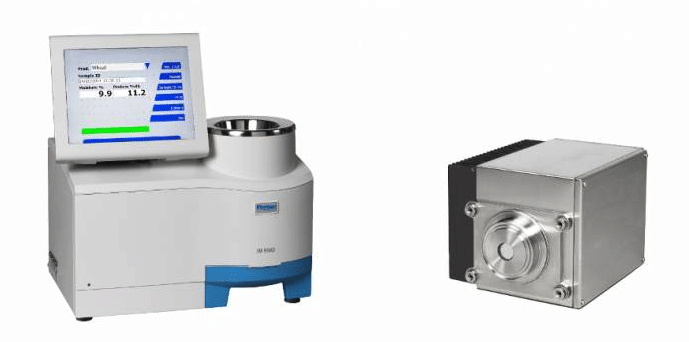
Both instruments, IM 9500 (to the left) and DA 7300 (to the right) use NIR Analysis. IM 9500 is a bench top instrument used for analysis of collected samples and is dust and humidity protected. DA 7300 is designed for on-line analysis in grain, flour, food and feed processing.
CustomersPerten has a wide range of customers. They span from large industrial farmers, companies in the food processing industry to multinational within the grain and flour trade. USA is the largest market and examples of growing markets are Argentine, Ukraine and Kazakhstan. Perten has a handful of competitors. – There is competition but it’s not fierce, I’d say. There are ten to fifteen companies in our line of business. About three or four of us own 60-70% of the market, says Patrik Hedeklint. Perten’s competitive edge is our long experience and presence in this business. Also our performance in terms of for example rapid test results, accuracy and fast response when technical support is required. He believes that the relative small size of the company is an advantage. |
|
|
|
|
Competing with flexibility |
|
|
A customer may want to use a Perten instrument in corn processing. But the hole pattern and physical dimensions of the mechanical interface needs to be adjusted. Perten are able to win the order by adjusting the mechanical interface of the product. Yet other examples of the winning concept of flexibility are introduction of alternative communication interfaces and additional means to control the instruments. Perten offers fourteen instruments for testing of ingredients and finished products of grain, flour, food and feed. Anders Viljosson, Embedded Systems Architect at Perten describes the motivations behind a new design strategy for the embedded computer platform in the DA 7250 NIR analysis instrument. |
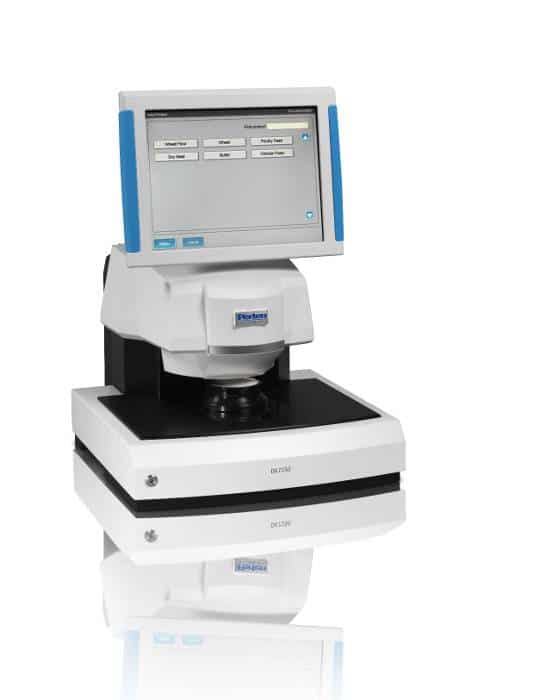
The DA 7250 NIR instrument is a fast and accurate with abilities to analyze whole grains, powders, pastes, pellets, slurries and liquids on one instrument.
|
One of the driving forces for the change was to make future generation shifts less complicated. It’s not likely to find a replacement in the same form factor and with the same communication interfaces when the COTS motherboard goes end of life. Yet another motivation for changing the design of the embedded computer was to reduce the amount of cables and connectors.
– Removing cables and connectors means reducing the risk for malfunction due to vibration or shock, says Anders Viljosson. And generally reducing the source of errors that cabling represents in production and of course reduce cost. |
|
|
|
|
Choosing the semi-custom strategy with COM and carrier board |
|
|
The discussions and decisions landed in going for the design strategy to use a CPU module in the COM Express form factor on a tailor made carrier board in the DA 7250. In this way Perten gained control over board dimensions, hole patterns and communication interfaces.
– We wanted to use the most common substandard in COM Express to be able to choose from a wide range of CPU module options and replacements for future generation shifts.Among existing options the choice fell on the Hectronic H6812 COM Express module, the version using the Intel Atom D525 dual core processor. H6812 supports COM Express pinout type 2, one of the more common sub-standards in COM Express.An important requirement for the COM module was an extended operating temperature range. H6812 is originally specified for a temperature range of 0°C to 60°C but temperature tests in Hectronic’s climate chamber and a selection based on the results opened up for an extended temperature range, 0°C to +70°C in this case. The procedure is called temperature screening. – We needed as much computing performance as possible, but then again, as little as possible heat generated from the processor platform as possible and our software engineers asked for a dual core platform. |
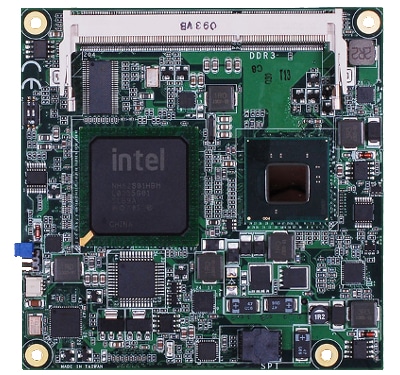
H6812 – Description
The Hectronic H6812 COM Express module is based on Intel® Atom™ processors N455/D425/D525. This is a low power platform with two CPU options for fanless operation and one with dual core technology aimed at designs requiring increased computing performance.
Features:
• Processor options:
– N455 (1.66 GHz, single core)
– D425 (1.8 GHz, single core)
– D525 (1.8 GHz, dual core)
• Interface examples:
– 1 IDE and 3 SATA 2.0
– 5 PCIe x1 and 8 USB 2.0
– 1 Gb LAN, LVDS 18-bit single ch.
|
Perten developed the carrier board themselves. Communication interfaces included on the H6812 module were made accessible via the standardized COM express type 2 connectors on the carrier board. Perten used, among other things, LAN, a hard disc interface, LVDS, VGA and a number of USB interfaces.
|
|
|
|
|
Carrier board functionality |
|
|
Functionality on the carrier board control the motor rotating the sample plate, activates and deactivates the light shutter, moves the reference reflection surface for calibration of the instrument and handles the spectrometer connected to one of the USB ports.
– The layout of the carrier board is more complicated than the interface board but less complicated than a computer motherboard. Production costs aren’t increased from the complexity but development took us more time. I believe that cost reduction from decrease in cabling by far exceeds the investments we made in development of the carrier board, says Anders Viljosson. |
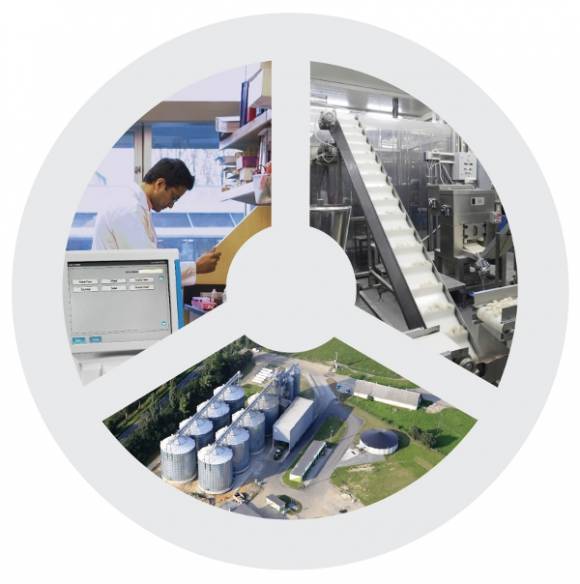
Perten products are used in a wide variety of industries such as grain or oilseed processing, petfood manufacturing or ethanol production. The instruments are in use in laboratories, at the production line or in the actual production process.
|
Hectronic supported Perten among other things through development of an adapted BIOS. Perten’s customers required identification of the instruments for administration purposes. The adapted BIOS allowed for product serial number, model number and manufacturer to be stored in the DMI area of the BIOS and to be accessible by the user of the instrument. Technical discussions about heat dissipation took place in an early stage of the project. |
|
|
|
|
Looking into the future |
|
|
Perten presents an annual growth of between 15% and 20%. The growth continues according to Patrik Hedeklint. He points to the growing interest in analyzing animal feed (to increase cost effectiveness for example in meat production), the awareness for food content and food safety and the growing number of countries that increase demands for efficiency and quality in grain production.
– I believe that much of the growth for us is coming from new countries and markets that begin to analyse grain, flour, food and feed, like countries on the African continent, India, Ukraine, Kazakstan and Turkey says Patrik Hedeklint.Perten is present is worldwide, in 100 countries, through local offices and distributors. The Perten Instruments Group headquarters are located in Stockholm, Sweden, and there are local offices in the USA, China, Germany, France, Italy, Australia and Russia. The company was founded 1962. |